Open-source personal project · In progress
trace-analyser
A quieter way to read what your coding agent actually did.
A coding agent finishes a task. The final message looks reasonable. But somewhere in the middle it ran the same command again, hit an error, or needed you to point it back toward the original request. That is the part I want to read.
trace-analyser brings saved coding-agent sessions into one local library. Open a session, find a moment worth inspecting, and follow it back to the recorded event. I’m building it to make that small act of investigation easier.
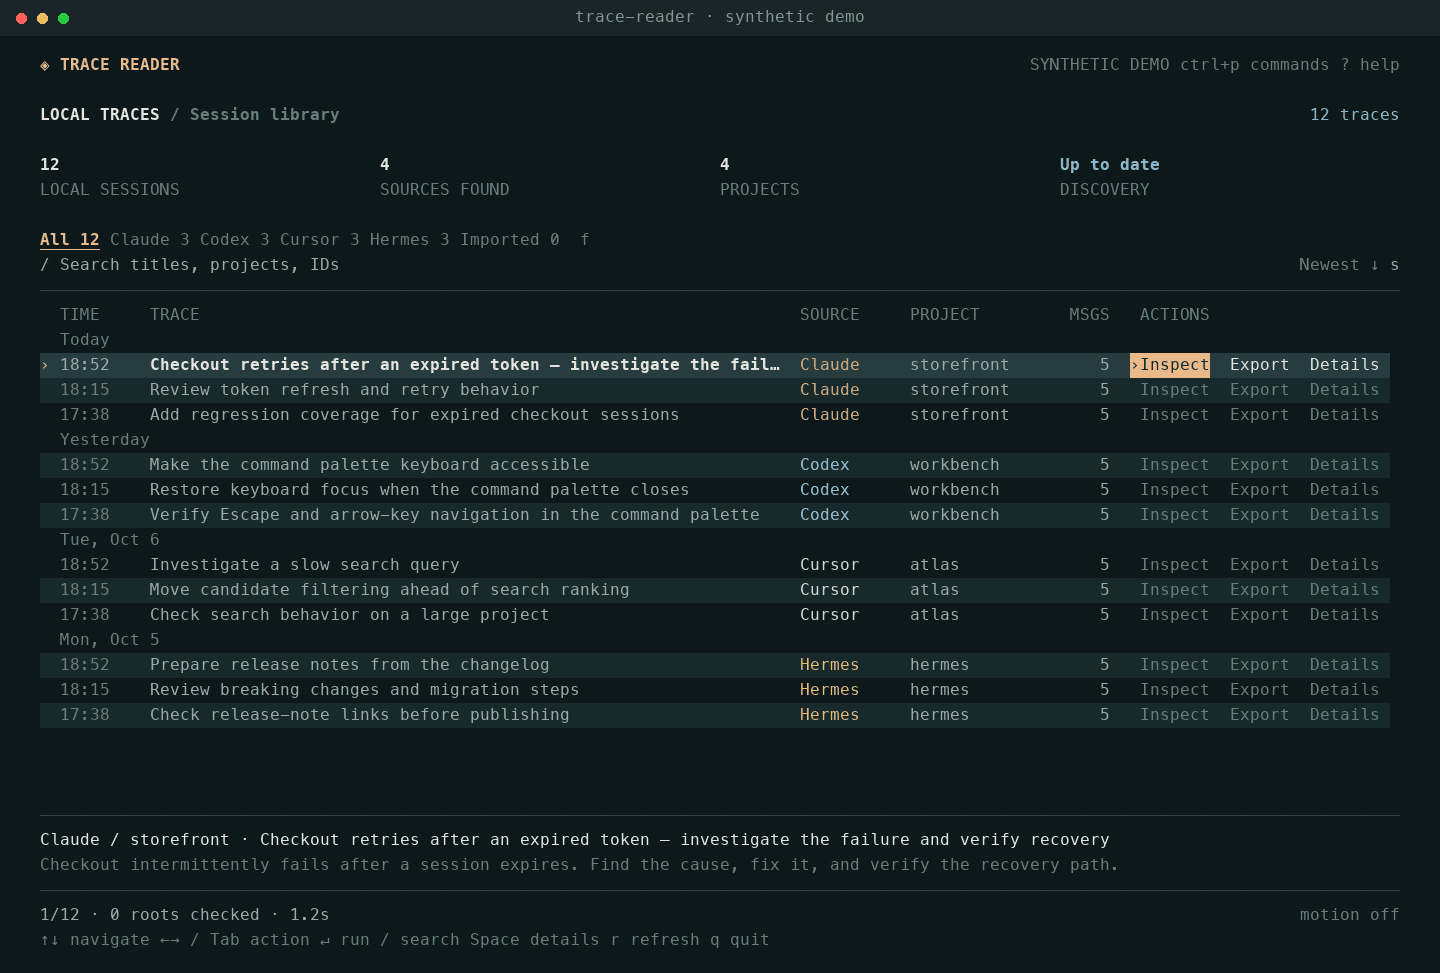
From a recording to a reading
The idea started with session recordings. Watching someone hesitate, repeat an action, or correct course can tell you something a final outcome misses. I wanted a way to give an agent’s conversation that same attention.
My early concept was a web player with a scrubber and annotations. The current implementation starts closer to the source: a terminal reader that works on sessions already on your machine. There’s no upload step, account, or model API key. The question behind it is still the same: what happened between the ask and the answer?
Three ways into the same session
Reading puts the first user request and last assistant message beside a short list of observations. Local rules identify reported tool errors, three or more calls with identical arguments, calls without matched results, and uncertain result links. Each observation has events you can open.
Timeline lets you move through messages, tool calls, and results in order. You can search their contents, include context records, and jump between the events behind an observation. Replay advances one event at a time at a fixed pace; it doesn’t reproduce the original timing.
Source shows the retained record and the limits of the capture. A missing result is left unresolved. Unsupported history and missing usage data stay visible as gaps. The tool doesn’t turn the last assistant message into a verified outcome.
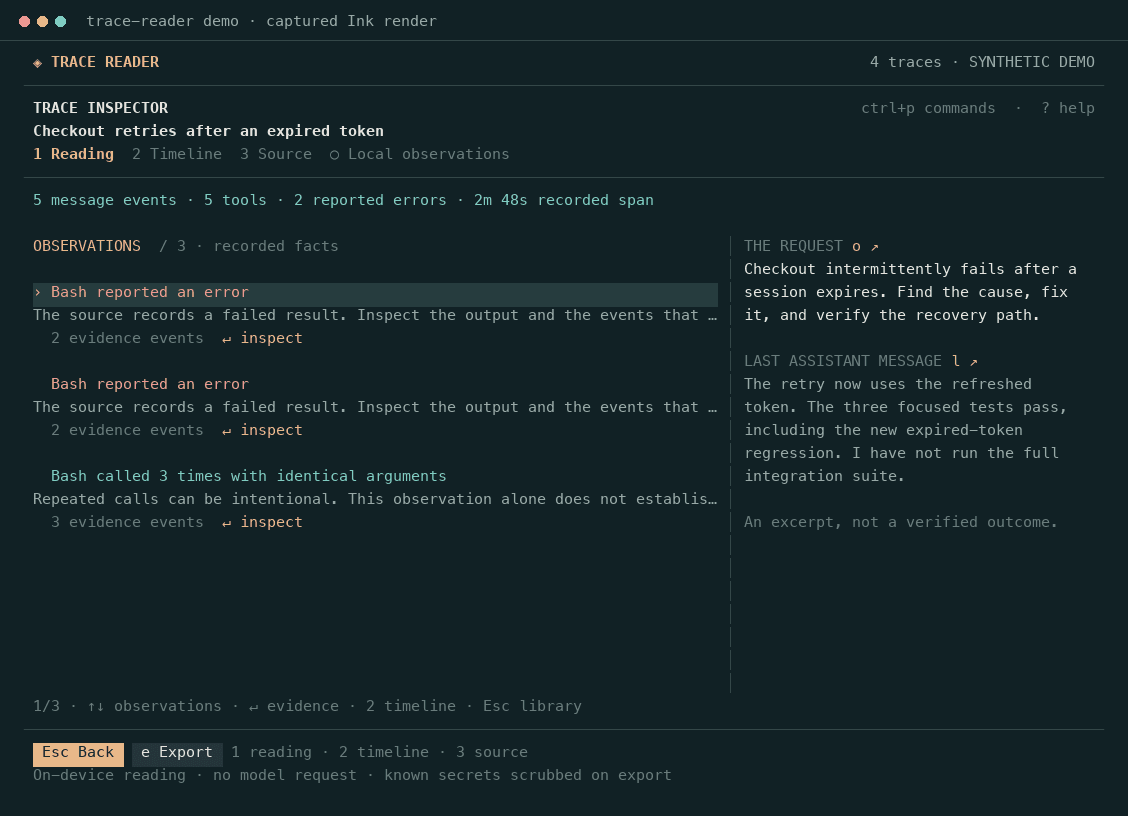
A useful observation leaves room for judgment
In the checkout example, the same test command runs three times. Two results report errors; the last passes after a change. The reader flags the repetition and lets you inspect all three calls. It doesn’t label the whole sequence a wasted loop.
That distinction shapes the product. The current reading is made with deterministic rules, with no AI request. It doesn’t infer mood, score satisfaction, or declare a task successful. It helps you find the evidence and form your own reading. I explore that idea in The art of reading traces.
Run it with npx
You’ll need Node.js 22.13 or newer. The package is published on npm. npx downloads and runs it for you:
npx trace-analyser@latestStart with the demo: twelve synthetic sessions across four sources, without scanning your saved conversations.
npx trace-analyser@latest demoFor repeat use, install it once with npm install -g trace-analyser and run trace-analyser in an interactive terminal; trace-reader still works as an alias. It looks in the supported local stores for Claude Code, Codex, Cursor, and Hermes. No account or model API key is needed.
- ↑ / ↓ to choose a session; Enter to inspect it.
- / to search, and f to filter by source.
- Inside a session, choose an observation and press Enter to see its evidence.
- ? for help; q to go back or quit.
If sessions aren’t showing up, trace-analyser doctor checks store paths, permissions, and parser support. To work from source instead, clone the repository, run npm ci and npm run build, then npm start.
Read a specific trace
Once installed, you can also read a supported file directly. JSON output includes observations, evidence event IDs, and capture coverage, so another tool can inspect the same reading.
trace-analyser read --file ./session.jsonl
trace-analyser read --file ./session.jsonl --json
Exports are explicit local files. Known credential patterns are scrubbed, but the result still needs review before sharing; the scrubber doesn’t guarantee anonymisation.
Let your coding agent set it up
Paste this prompt into your coding agent. It will check your Node.js version, run trace-analyser with npx, and launch it in your terminal.
Copy and paste into your coding agent to get started.
A work in progress
This is a developer preview. After installation, discovery, inspection, and export run locally without network requests. Source transcripts remain read-only; discovery can keep a local metadata index to make later scans faster.
It reads Claude Code and Codex session files, Hermes’s SQLite sessions, and experimental Cursor formats. Explicit imports also support the tool’s export format and role/content JSON arrays. Support depends on what the source saved. The earlier plans for hosted playback, model-written readings, and OpenTelemetry imports aren’t part of this version.